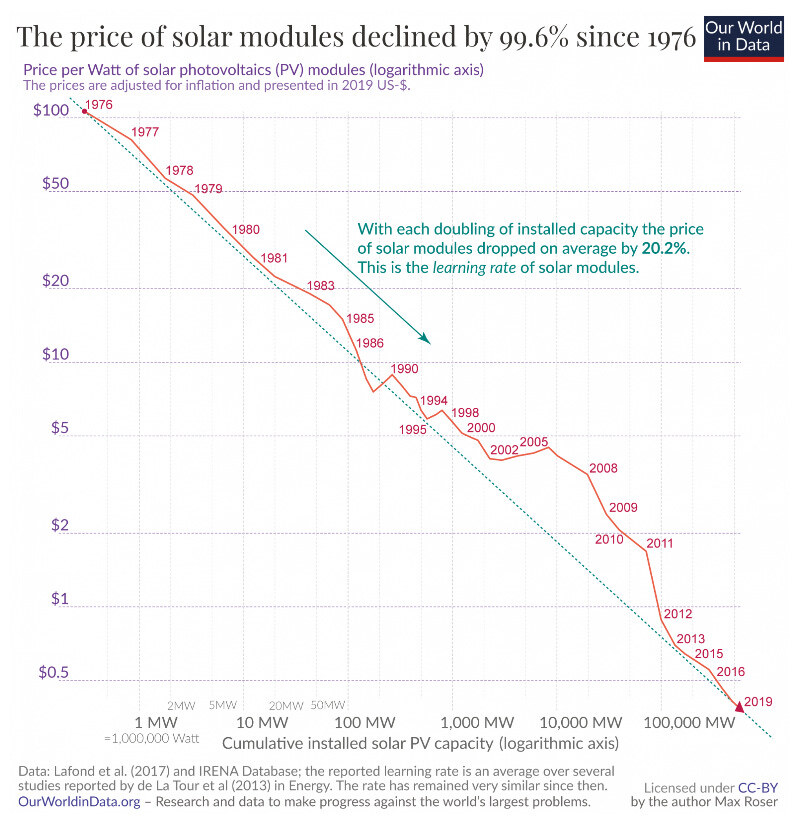
Learning curves: How manufacturing scale drives cost reduction
Create a detailed analysis:
Historical learning rates (2015-2024)
- PEM: 8-12 percent cost reduction per doubling of cumulative production
- SOFC: 5-8 percent cost reduction per doubling
- Alkaline: 6-10 percent cost reduction per doubling
- SOEC: 10-15 percent cost reduction per doubling (early stage)
- AEM: 12-18 percent cost reduction per doubling (emerging technology)
Current production volumes and trajectory
- PEM: ~50,000 units/year globally → projected 500,000 by 2030
- SOFC: ~5,000 units/year → projected 50,000 by 2030
- Alkaline: ~10,000 units/year → projected 100,000 by 2030
- SOEC: ~1,000 units/year → projected 50,000 by 2030
- AEM: less than 500 units/year → projected 10,000 by 2030
Cost reduction potential (2024-2030)
- PEM: 30-40 percent reduction expected
- SOFC: 20-30 percent reduction expected
- Alkaline: 25-35 percent reduction expected
- SOEC: 40-50 percent reduction expected
- AEM: 50-60 percent reduction expected
Lifetime and degradation: The hidden cost driver
PEM Fuel Cells
- Typical lifetime: 5,000–10,000 hours
- Degradation rate: 2–5 percent per 1,000 hours
- Primary failure modes: Membrane thinning, catalyst poisoning, corrosion
- Replacement cost: 30–40 percent of initial stack cost
SOFC
- Typical lifetime: 40,000–80,000 hours
- Degradation rate: 0.5–2 percent per 1,000 hours
- Primary failure modes: Electrolyte cracking, interconnect oxidation
- Replacement cost: 25–35 percent of initial stack cost
SOEC
- Typical lifetime: 20,000–40,000 hours (emerging data)
- Degradation rate: 1–3 percent per 1,000 hours
- Primary failure modes: Oxygen electrode degradation, electrolyte densification
- Replacement cost: 35–45 percent of initial stack cost
Alkaline
- Typical lifetime: 10,000–20,000 hours
- Degradation rate: 1–4 percent per 1,000 hours
- Primary failure modes: Electrode corrosion, electrolyte decomposition
- Replacement cost: 25–30 percent of initial stack cost
AEM
- Typical lifetime: 5,000–15,000 hours (limited field data)
- Degradation rate: 2–6 percent per 1,000 hours
- Primary failure modes: Membrane degradation, ionomer stability
- Replacement cost: 30–40 percent of initial stack cost
Degradation rates vary significantly based on operating conditions, fuel purity, and thermal cycling. These ranges reflect best-case scenarios with optimized operation.
CAPEX varies dramatically by
region and deployment context
North America
PEM: $4,000–5,500/kW
SOFC: $5,000–7,000/kW
Drivers: Mature supply chain, high labor costs, established OEMs
Europe
PEM: $3,500–5,000/kW
SOFC: $4,500–6,500/kW
Drivers: Green hydrogen incentives, strong manufacturing base, policy support
Asia-Pacific
PEM: $2,500–4,000/kW
SOFC: $3,500–5,500/kW
Drivers: Lower manufacturing costs, rapid scaling, emerging players
Emerging Markets
PEM: $3,000–4,500/kW
SOFC: $4,000–6,000/kW
Drivers: Limited local production, import costs, early deployment phase
Regional costs reflect 2024 data from commercial deployments. Prices decline 5–8 percent annually as manufacturing scales.
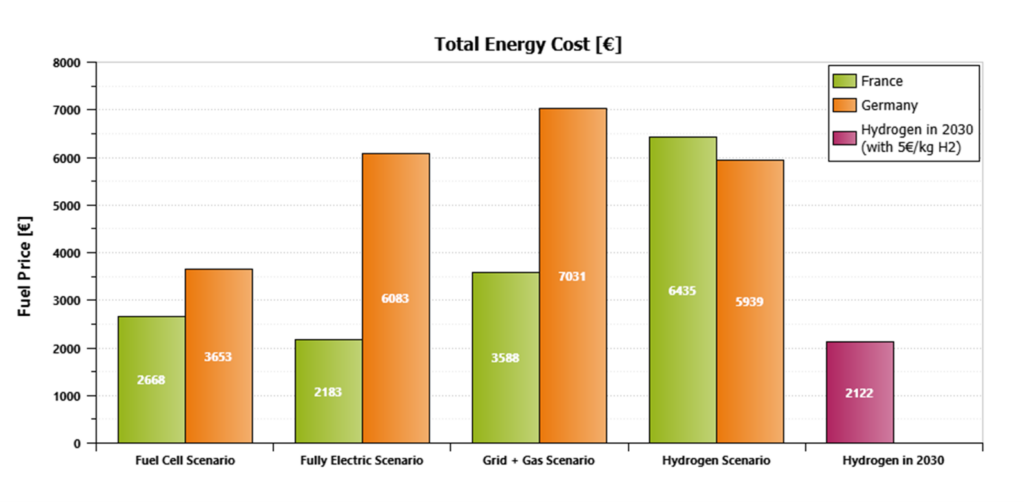
Real-world fuel cell cost modeling scenarios
Transportation fleet electrification
Decision: Should we deploy PEM fuel cell buses or battery electric buses?
ENKI analysis: Compare total cost of ownership (CAPEX + OPEX + fuel) over a 10-year lifecycle.
- Hydrogen fuel costs, electricity prices, maintenance intervals, residual value.
Outcome: Identify breakeven hydrogen price and deployment timeline.
Industrial hydrogen production
Decision: Build an alkaline or SOEC electrolyzer for green hydrogen?
ENKI analysis: Model CAPEX, electricity costs, degradation, and production efficiency.
- Electricity price, capacity factor, stack replacement cycles.
Outcome: Calculate levelized cost of hydrogen (LCOH) under different scenarios.
Stationary power and CHP
Decision: SOFC or natural gas generator for backup power?
ENKI analysis: Compare installed cost, fuel efficiency, maintenance, and reliability.
- Natural gas prices, electricity rates, thermal demand, grid reliability.
Outcome: Determine payback period and optimal system size.
Technology roadmap planning
Decision: Which fuel cell technology should we invest in for 2030?
ENKI analysis: Project cost trajectories, learning curves, and market adoption.
- Manufacturing scale, technology breakthroughs, policy support.
Outcome: Identify highest-potential technology and investment timing.
Market sizing and TAM
Decision: What is the addressable market for fuel cells in our region?
ENKI analysis: Model deployment potential across applications and geographies.
- Cost competitiveness, policy incentives, infrastructure readiness.
Outcome: Build defensible TAM/SAM/SOM for strategic planning.
Each scenario is built with transparent assumptions, cited data, and probability ranges. You can pressure-test your decisions against different market conditions.
How ENKI builds defensible fuel cell cost models
Primary data sources
- Company filings: Annual reports, investor presentations, earnings calls
- Deployment databases: Installations, capacity additions, performance data
- Supply chain intelligence: Material costs, manufacturing capacity, lead times
- Research publications: Efficiency, degradation, lifetime studies
- Patent filings: Technology roadmaps and innovation signals
Data normalization process
- Standardize CAPEX across sizes/configurations
- Adjust for regional cost variations and currency effects
- Account for balance-of-plant and integration differences
- Normalize OPEX assumptions to consistent operating conditions
- Resolve conflicting data using triangulation
Scenario modeling
- Base case: Conservative assumptions, technology maturity
- Optimistic case: Faster learning curves, breakthroughs
- Pessimistic case: Supply chain constraints, slower adoption
- Policy scenarios: Subsidies, carbon pricing, regulation impacts
Validation and updates
- Monthly tracking of deployments and cost announcements
- Quarterly learning-curve recalibration
- Annual review of technology roadmaps and R&D progress
- Cross-checking against published analyst reports
- Consistency checks through multi-source validation
Every cost estimate in ENKI is backed by specific sources. You can drill down to see the underlying data, assumptions, and citations.
If you need a cost model that engineering, finance and leadership can trust, begin with evidence not forecasts.
Start building defensible fuel cell cost models today. See how ENKI transforms scattered data into strategic clarity.